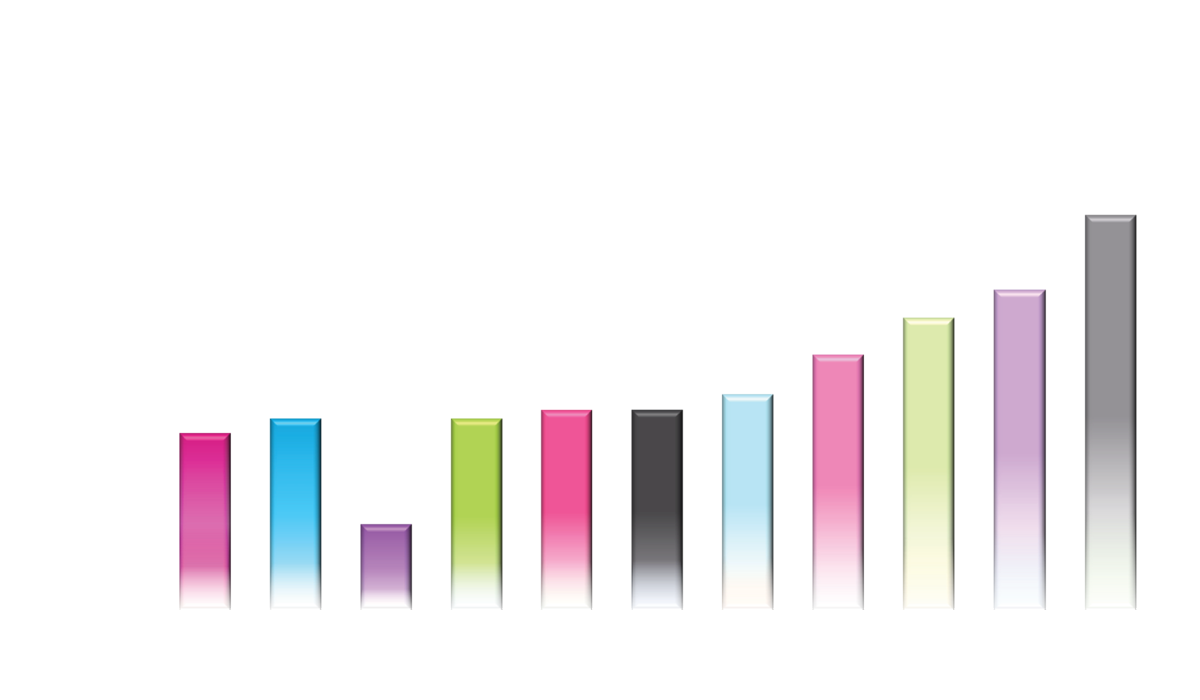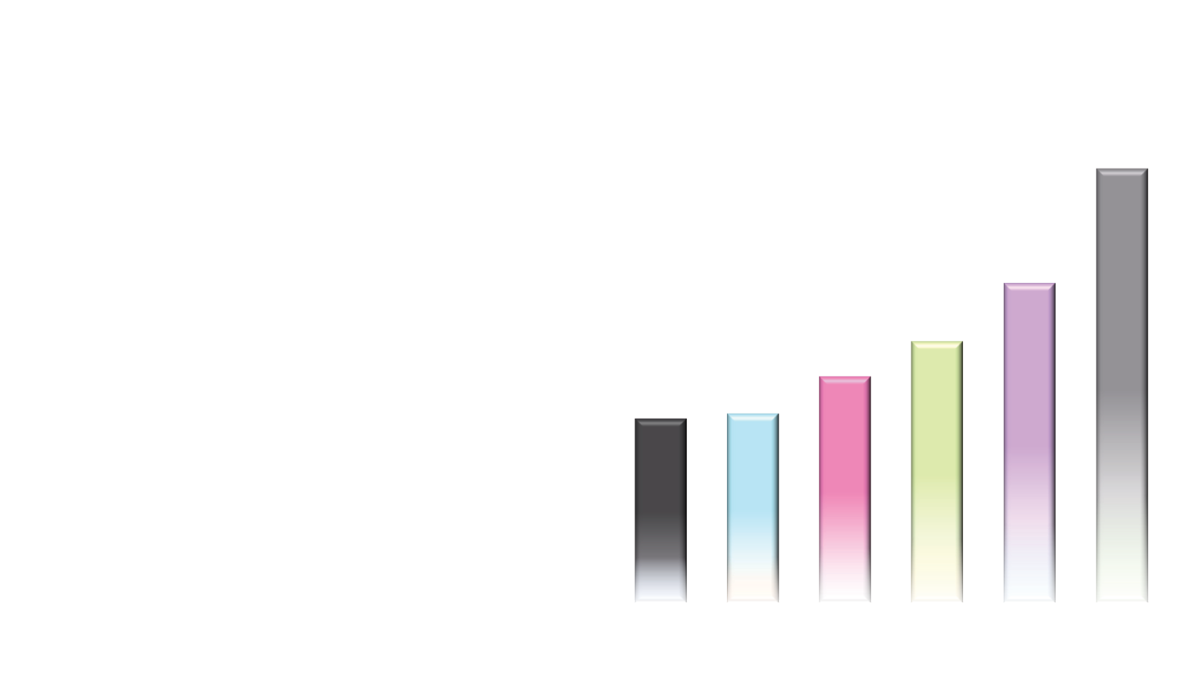


*Transition year 2014 represents 5 months of operations.
**Figures from 2016 are under Ind AS framework and the figures for 2015 and prior years are under previous Indian GAAP.
#2018 cash and cash equivalents is net of cash outlay of ₹11,060 million for the buyback of equity shares completed during the year.
##2019 cash and cash equivalents is net of cash outlay of ₹9,949 million for the buyback of equity shares completed during the year.
###2022 cash and cash equivalents is net of cash outlay of ₹5,219 million for Blink UX acquisition and ₹5,058 million for special dividend of ₹27 per share.