"Content is king, but marketing is queen. And the queen runs the household." Gary Vaynerchuk, 2008.
Introduction
In an earlier post, I wrote about observability, which is a property of a system: a measure of how well the internal states of a system can be inferred from knowledge of its external outputs. In a distributed system, observability as a system property turns into a cross-cutting concern across all components of that system. In my post, I suggested the use of a micro-service chassis framework, promoted using a service template, as a means to a coordinated introduction of tracing, health checks and metrics.
Once the components of a distributed system are engineered to be observable, it is desirable to manage such components through a real-time, closed-loop control process. In physical process control implementations, the logic of the control loop observes the device through sensor metrics and takes corrective measures through actuator actions. Observability provides us the metrics, but how do we take corrective measures? That is where controllability comes in.
Controllability
Wikipedia has this to say about controllability: "The concept of controllability denotes the ability to move a system around in its entire configuration space using only certain admissible manipulations". In the context of distributed systems, "the system" refers to a component or service within our system. The "configuration space" refers to a component's settings that impact its behavior.
When we're engineering a distributed system, or more importantly when we're architecting a repeatable design for multiple distributed systems, we shouldn't attempt to control much of the component-specific behavior; that is not a repeatable design. Instead, we should focus on more generic elements of control such as a component's memory footprint, it's CPU consumption rate or it's disk storage access rates. When we consider the class of components that are task-oriented, we can further consider the task processing rate as an important control element.
While we're at it, it makes sense to introduce controllability over the observability of components. Are you still with me? Controlled observability means that we can manage the flow rate of metrics, tracing levels, and heartbeats. This is a desirable system property, because it allows us to increase a component's observability as the need arises and decrease it once that need is gone.
For components with external dependencies (aren't all component dependent at some point?), a 'dependency health check' is a viable candidate. The idea being that a component would know of its own dependencies. When asked, it could check the health state of such dependencies, like a 'ping' on each dependency, and subsequently send out a health metric on those dependencies.
Related to controlled observability, we consider the use of signals as a form of inter-process communication, as it is used in Unix or POSIX-compliant systems (Wikipedia). Common uses of signals are to interrupt, suspend, terminate, or kill a process. In a distributed system, we can introduce signal like controls such as 'suspend', 'resume', 'terminate', 'add thread', 'remove thread', etc.
Controlling component-specific behavior
A generic control framework shouldn't be expected to control intricate component specific aspects of behavior. Instead, such elements of configuration should be made available through alternative means, such as configuration files or configuration registries.
The link with controllability is that you can define a triggering control instruction to "re-evaluate the configuration instructions". I like to think of this as a triggered pull (not to be confused with pulling a trigger). Richardson writes about pull based externalized configurations in more detail (Richardson, C., 2019, Microservices Patterns, Manning, ISBN 978-1-61729-454-9).
An example of a use case for a triggered pull is when a component relies on a set of rules during its execution. When the rules change, the component can be instructed to re-read the rules without a forced termination of the process.
Cost-controlling a cloud solution
When observability is applied for the benefit of cloud cost control (FinOps), fine grained component control can be used to tune the resource consumption of deployed components. In particular, multi-threading a worker component gives us the ability to actively manage the thread count and thereby the overall resource utilization of the component on its server. Depending on the cost profile of the underlying cloud infrastructure, we now have the flexibility to either add another server to the cluster, with another instance of the same component deployed on it, or we increase the resource utilization of the existing component by increasing its thread count. Further, we can migrate a live component away from its current server to a different server with different cost/performance characteristics.
The service chassis revisited
A service chassis is a mechanism that handles cross-cutting concerns. It introduces a separation of concerns: the implementation of service application logic is isolated from the implementation of the cross-cutting concerns. Both observability and controllability introduce cross-cutting concerns. Pete Hodgson writes about the benefits of service templates and the service chassis, and he has a few clarifying illustrations to go with that:
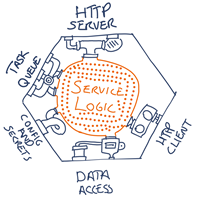
The role of the service chassis (source: Hodgson)
Hodgson is interested neither in observability nor controllability, instead he's making a plea for 'shared plumbing'. When you analyze the above illustration further, you'll note that the service logic itself still integrates with the plumbing, albeit in a 'standardized' way. From the perspective of the service logic designer, life has not been made any simpler.
When we think of a chassis for observability and controllability, we can take this a bit further. Some of the responsibilities around observability/controllability can be covered completely by the chassis – the service logic doesn't even have to know about it. For example, consider the 'suspend' control: that could be as simple as shutting off the task queue in the above illustration. The service logic is still listening for new tasks, but the chassis prevents tasks from arriving at the service logic.
In the same vein, many of the observability aspects can be realized by the chassis without the service logic being involved.
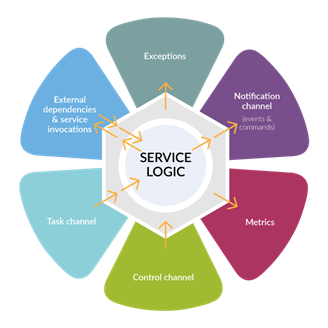
A service chassis taking care of business
The control plane
In the magical world of network routing, a control plane is the part of the router architecture that is concerned with drawing the network topology, or the information in a routing table that defines what to do with incoming packets (Wikipedia). The data plane, on the other hand, actually forwards the packets. The data plane is also called the forwarding plane.
In the world of distributed systems, people started using the terms control plane and data plane to explain the concept of a service mesh. Marcus Schiesser wrote a useful introduction to the theme in Managing Microservices with a Service Mesh: Data vs. Control Plane".
Once we realize observability and controllability using a service chassis, we operate the distributed services though the data plane, and we manage them via the control plane. In other words, the control plane is responsible for gathering the observability metrics and for issuing the control instructions.
Scope of control
Assuming we have decided to introduce a control plane, we will need to think about its scope. When we create a solution architecture for a problem domain X, we may end up with a distributed system comprised of, say, 15 components. All 15 need to be deployed for the solution to work. We'll need to control all 15 service components. Now, we deploy X in a test environment (Xtest), in a QA environment (Xqa) and in a production environment (Xprod). Do they share a control plane, or do we realize three distinct control contexts?
And how about the introduction of another solution, for problem domain Y? That solution deploys 23 components (Yprod). Are they in a separate control context or not? And what if some components are deployed for X as well as for Y?
In the days of the monolith, things were simple. Scope aligns with monolith boundaries. In a distributed systems world, a similar scope definition applies; let us call it application scope. An application is a deployed set of components, including its observability and control features. Xprod is controlled separately from Xtest and Xqa.
For the purpose of controllability, we now need a feature, i.e. a deployed component, that is responsible for issuing control instructions to the application's services. That component can itself be managed externally, when required.
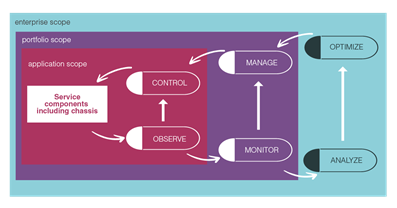
Application-level control, portfolio-level management, and enterprise-level optimization
The above illustration shows how application-level observability ('measure') can directly feed application-level control. Examples of this would be applying back pressure or the circuit breaker pattern.
Aggregated metrics are exposed to a portfolio-level monitor, for example a cluster of applications deployed on a public cloud for a given business unit. Decisions of scale-up and scale-down, and the associated activation of cloud resources, are taken at this level.
Ultimately, the combined observations across all portfolios are analyzed for the purpose of strategic optimization, providing guidance to portfolio-level management.